What Does a Full Agricultural Soil Analysis Report Tell You in Watsonville, CA?
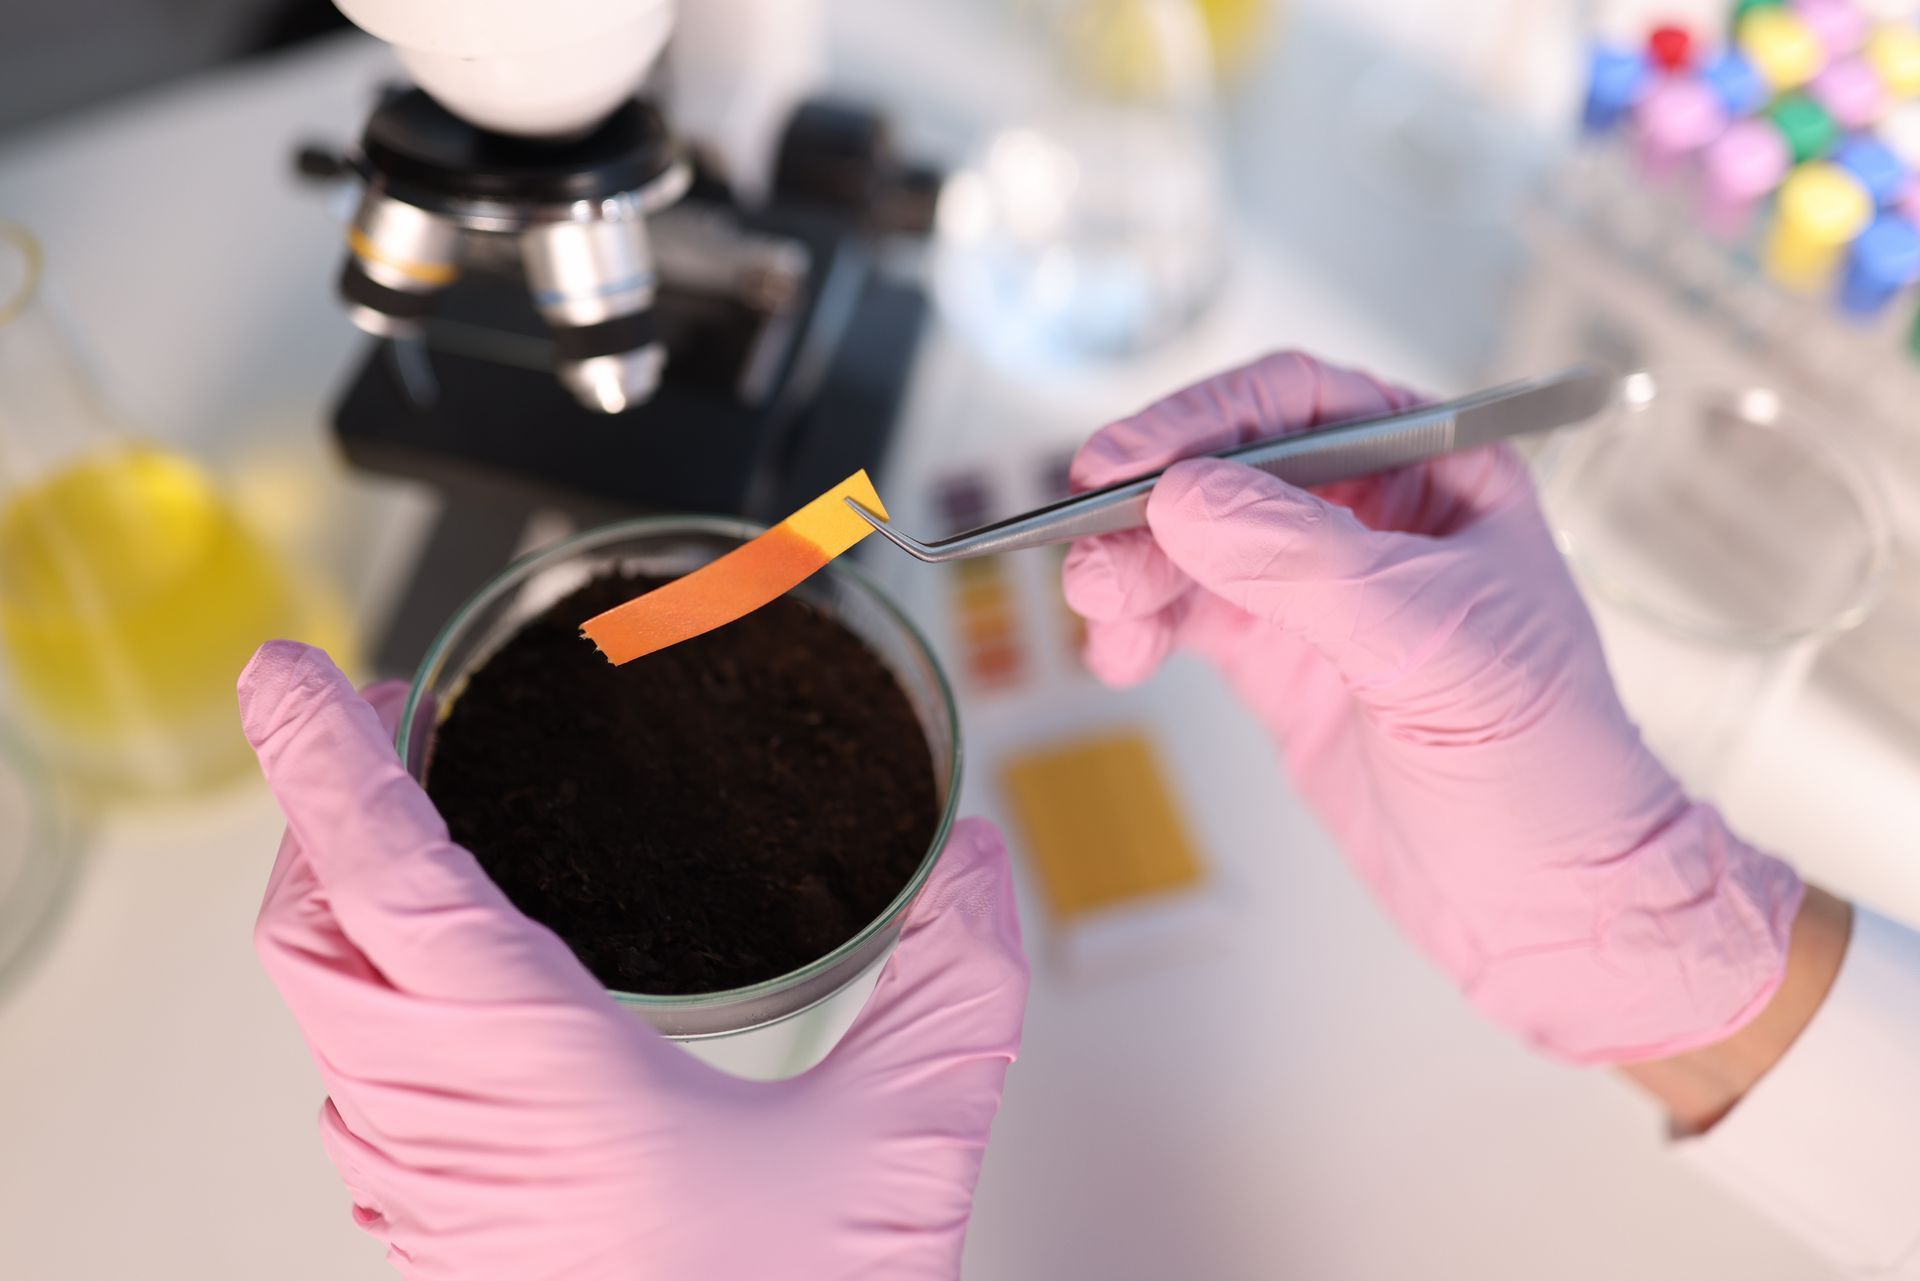
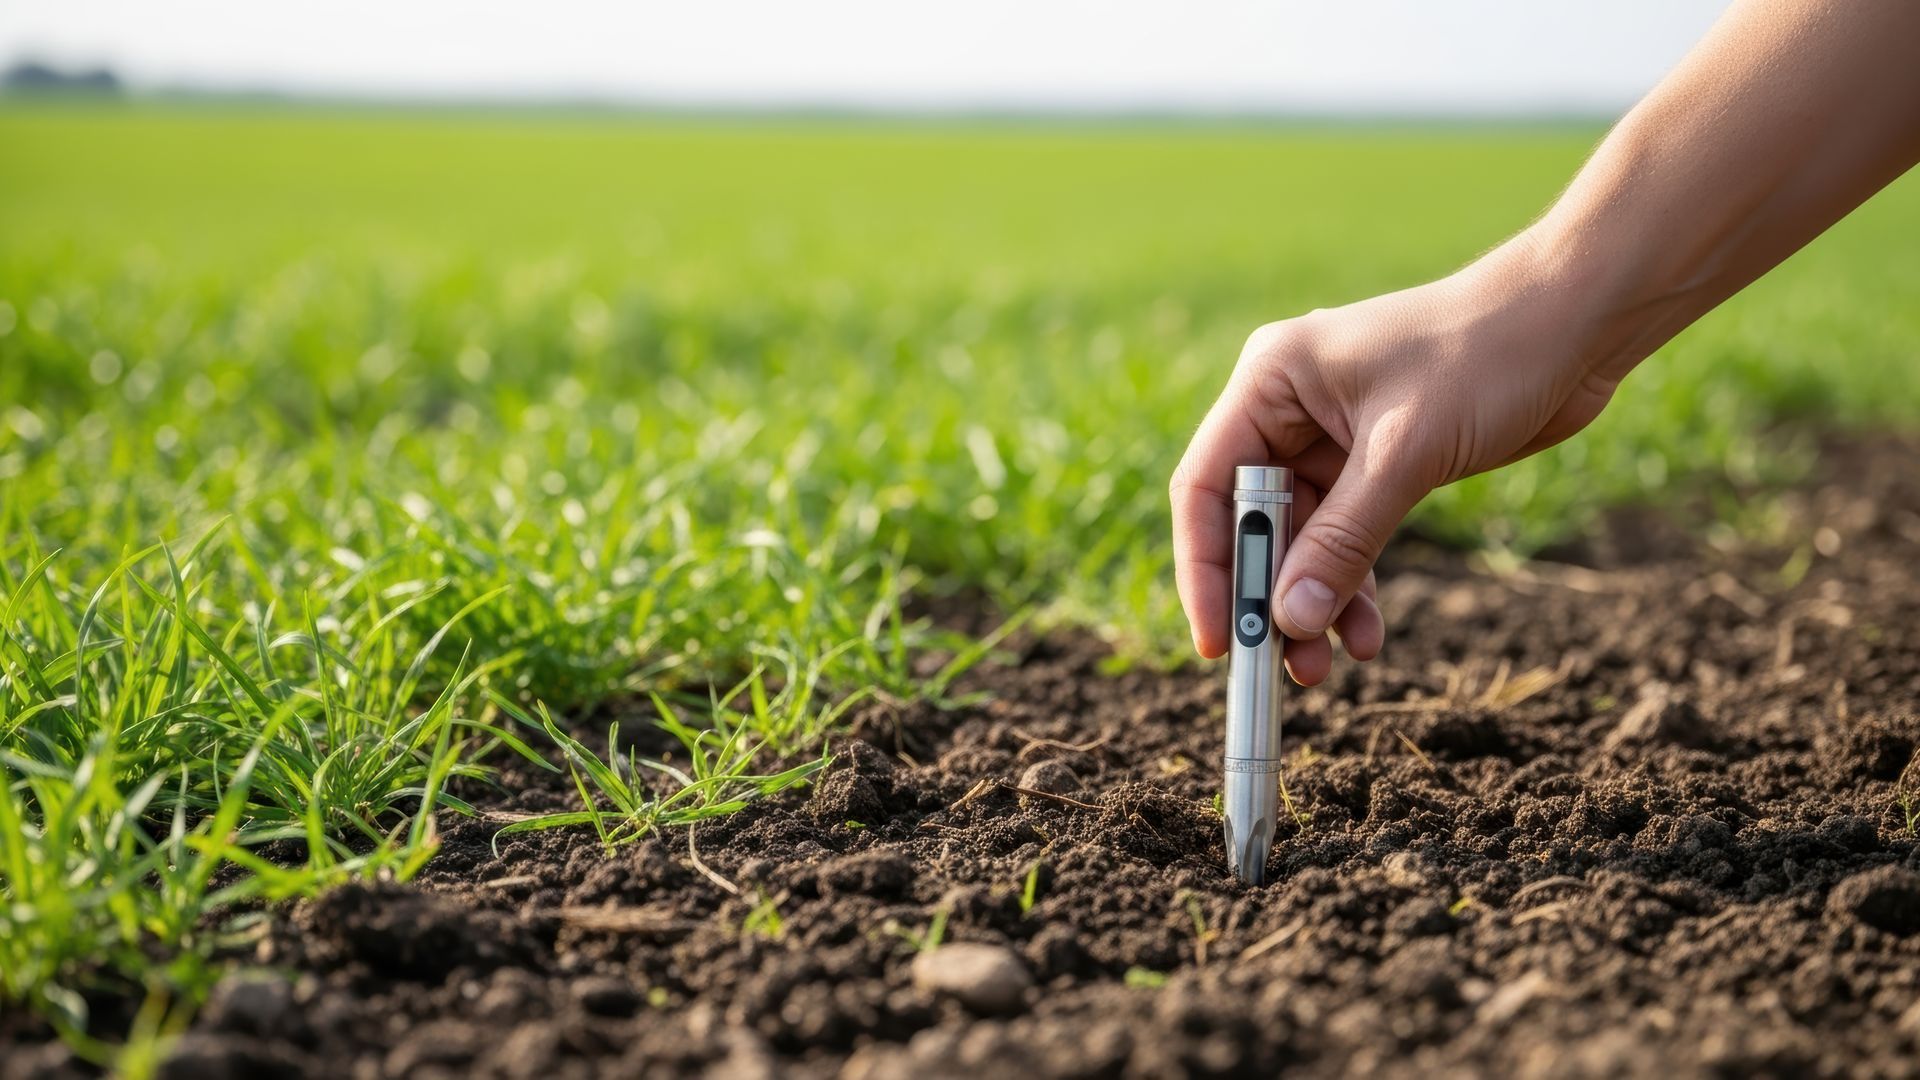
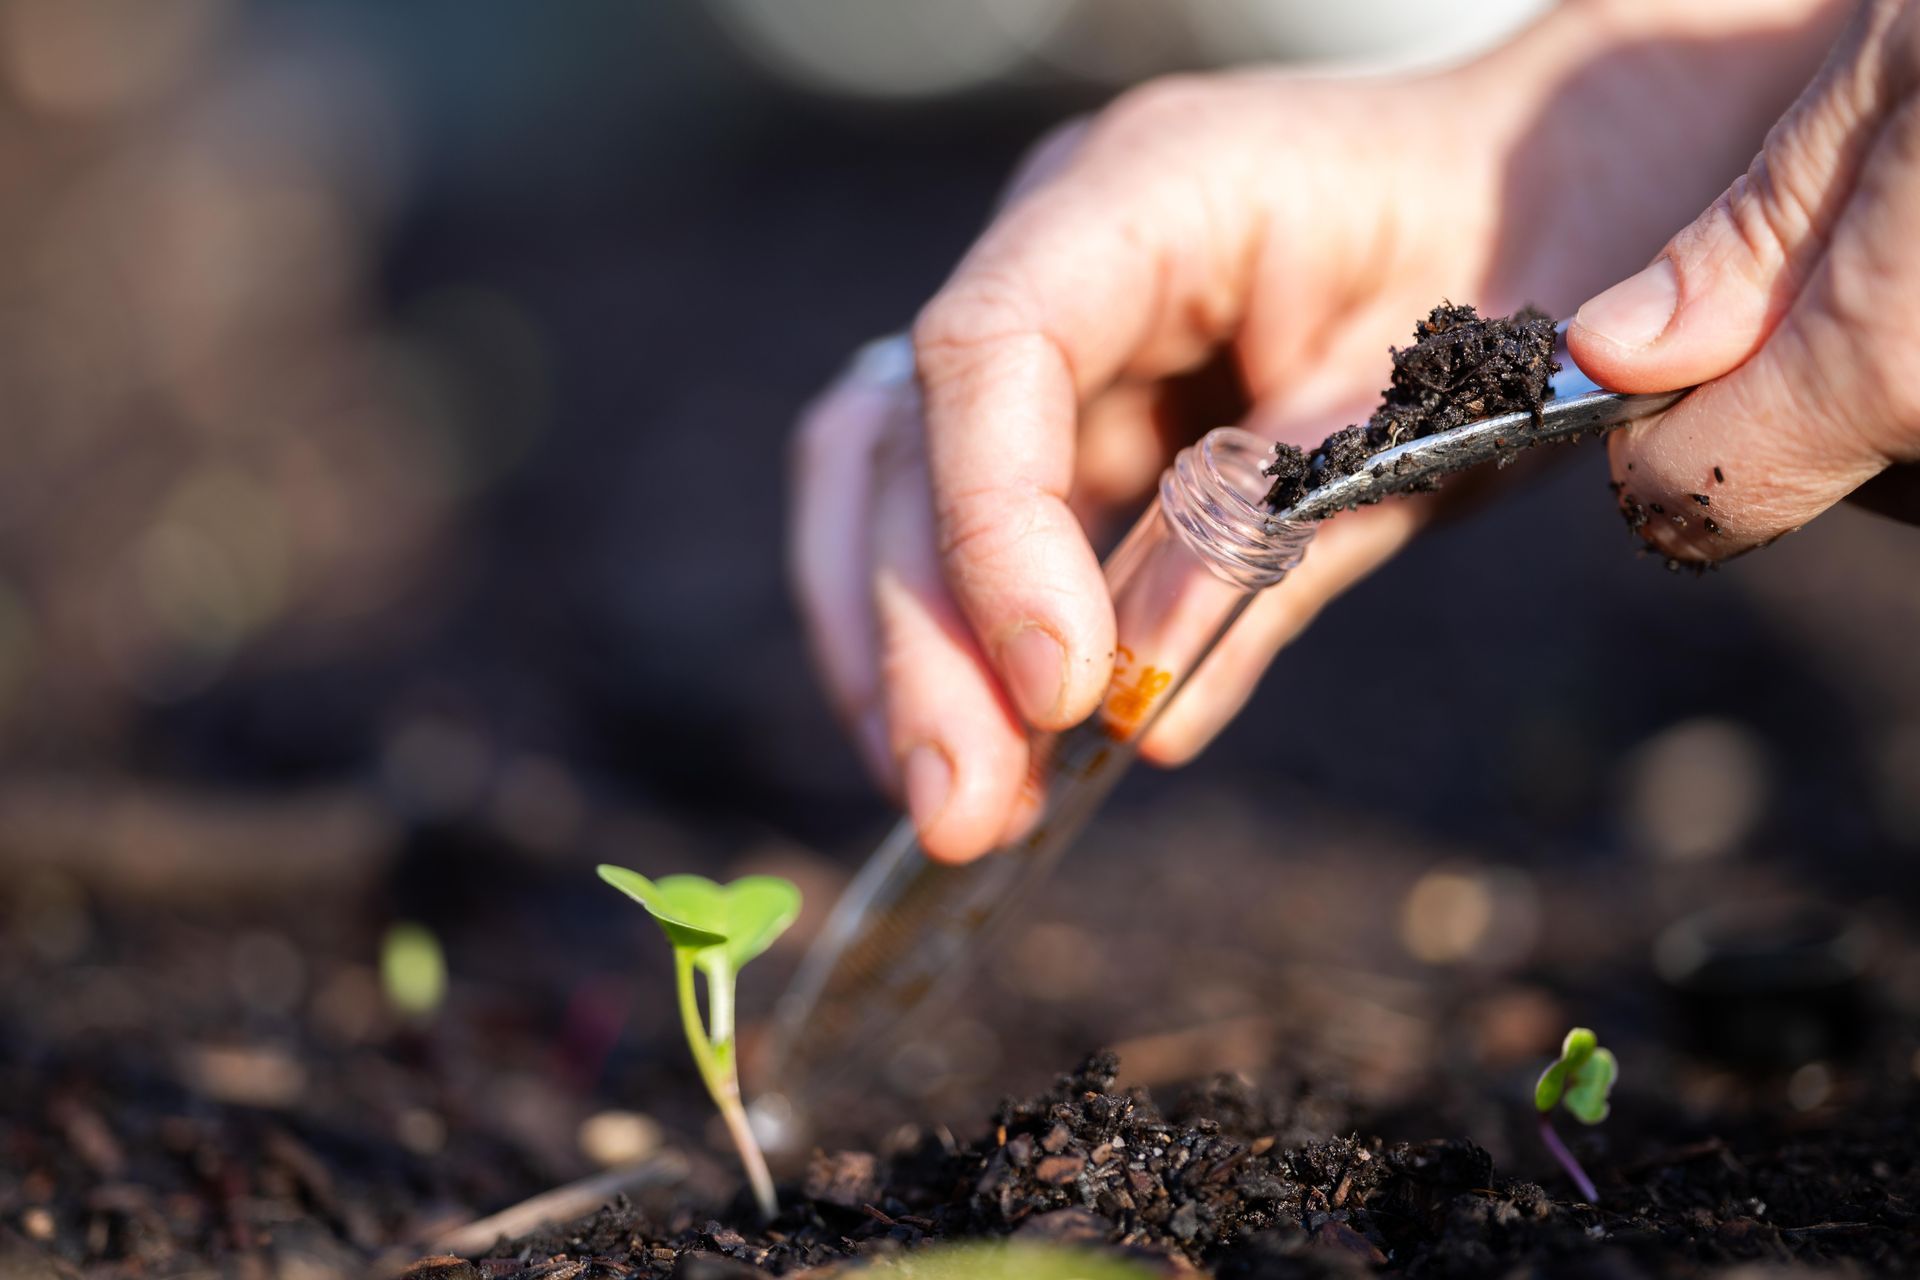
A full agricultural soil analysis report gives growers a detailed picture of their soil's chemical makeup, so they can fertilize smarter, adjust pH, and protect crop yields season after season. For farmers in Monterey County and the Pajaro Valley growing lettuce, strawberries, artichokes, and other high-value crops, understanding that report is one of the most practical tools available. Agricultural soil analysis is a well-established service that helps growers translate raw lab numbers into real field decisions.
This guide walks through each section of a standard report, explains what the numbers mean, and shows you what to do with the results.
What a Soil Analysis Report Actually Measures
A complete ag soil report covers nutrient levels, pH, organic matter, salinity, and cation exchange capacity. No single number stands alone; they all work together to describe how well your soil can feed a crop. Growers who invest in agricultural soil analysis get this complete picture before each planting cycle rather than guessing at what the field needs.
Macronutrients: Nitrogen, Phosphorus, and Potassium
Macronutrients are the big three that crops consume in the largest quantities.
Nitrogen (N) fuels leaf and stem growth and is the nutrient most quickly depleted in sandy coastal soils common to the Watsonville, CA, area. Phosphorus (P) supports root development and early establishment and can become locked up in high-pH soils even when present in adequate amounts. Potassium (K) regulates water movement inside plant cells and affects fruit size and quality, which matters significantly for strawberry and artichoke growers in the Pajaro Valley.
Because Monterey County fields often receive heavy irrigation, N can leach below the root zone quickly. Your report may flag this with a low nitrate reading even after a recent fertilizer application.
Secondary Nutrients and Micronutrients
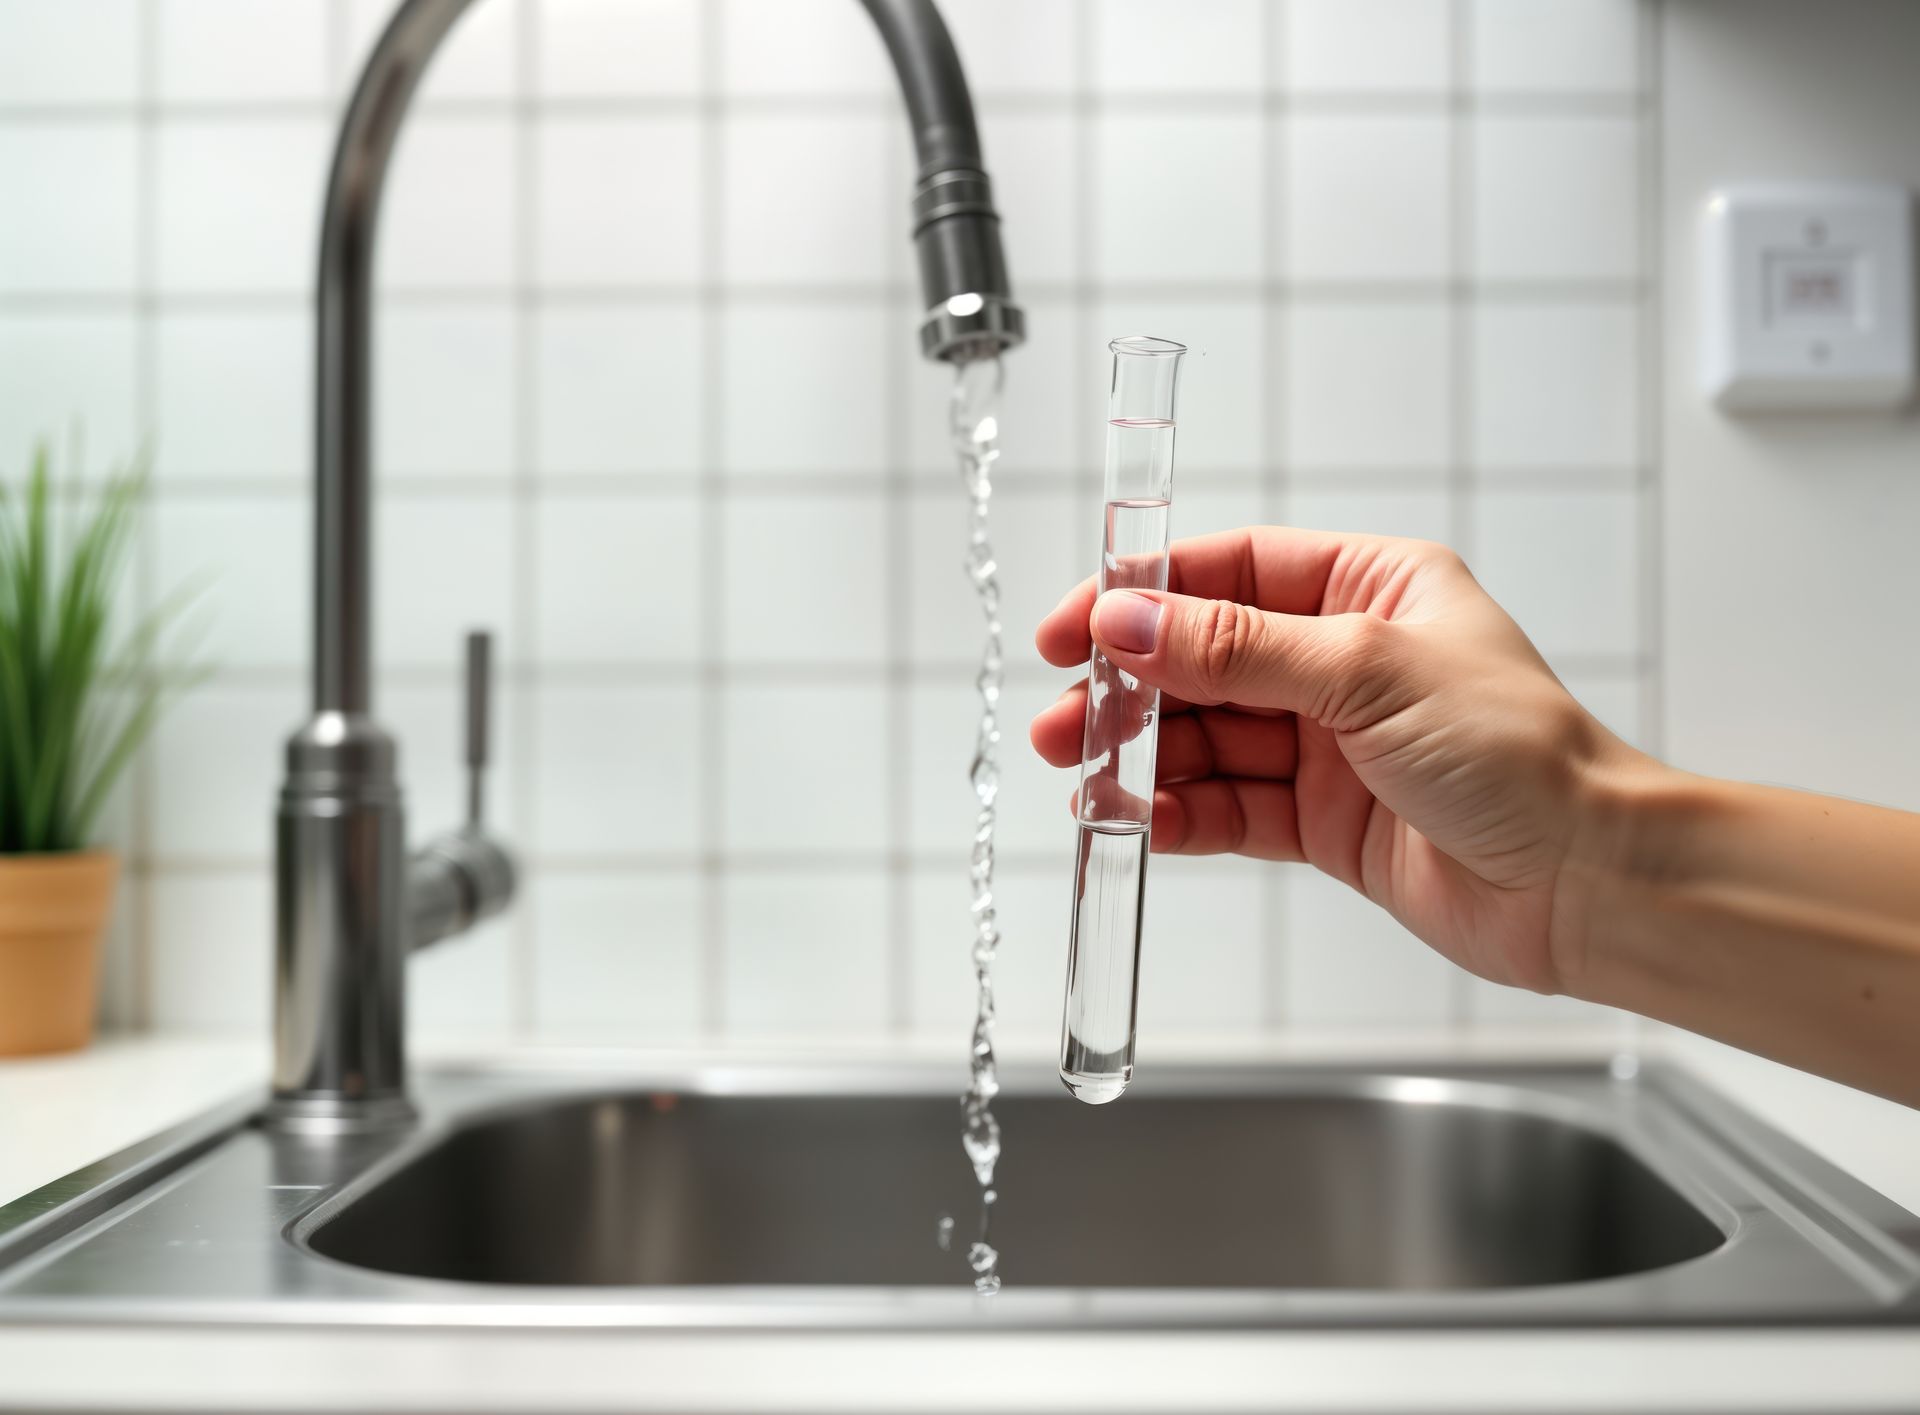
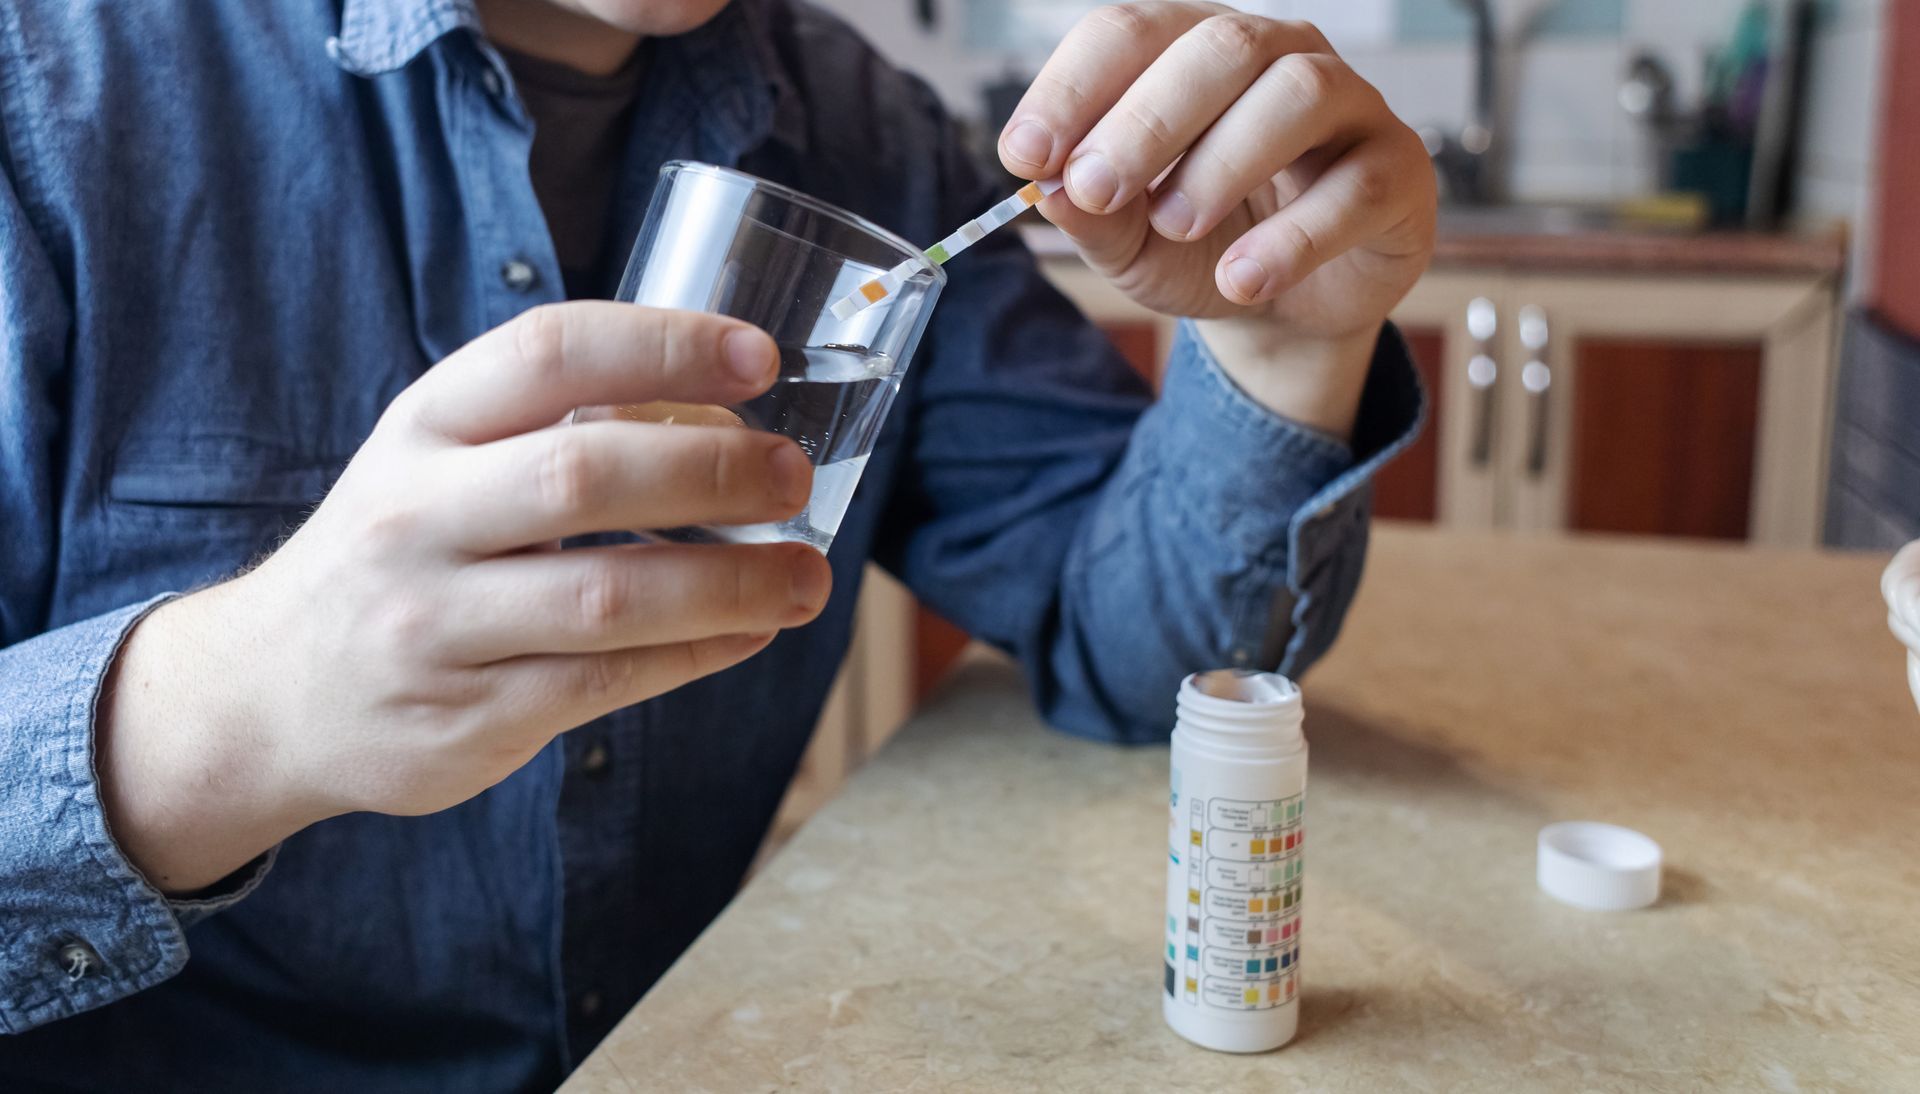
Secondary nutrients include calcium (Ca), magnesium (Mg), and sulfur (S). These appear in smaller amounts on the report but are just as important for crop quality. Micronutrients such as boron, zinc, manganese, iron, and copper appear at trace levels. Coastal vegetable growers in the Salinas Valley corridor sometimes encounter boron toxicity from irrigation water, so checking micronutrient levels alongside a water quality analysis can help you catch problems early.
How pH, CEC, Organic Matter, and Salinity Affect Your Crops
These four parameters often have the biggest influence on whether your fertilizer program actually works.
Soil pH
Soil pH measures how acidic or alkaline your field is on a scale of 1 to 14. Most vegetable crops grown in Monterey County, including head lettuce and broccoli, prefer a pH between 6.0 and 7.0. Outside that range, nutrients may become chemically unavailable even when present. Your report will often include a lime or sulfur amendment recommendation to bring pH into the target range.
Cation Exchange Capacity (CEC)
CEC measures how well your soil holds onto positively charged nutrient ions so they are not lost to leaching. Sandy loam soils common in parts of the Pajaro Valley tend to have lower CEC, meaning nutrients move through faster and may require more frequent, smaller fertilizer applications. Agricultural soil analysis results for CEC help growers in these sandier fields design fertilizer schedules that match their soil's holding capacity.
Organic Matter
Organic matter improves water retention, feeds beneficial soil microbes, and slowly releases nitrogen as it breaks down. Many intensively farmed fields in Monterey County show organic matter levels below 2%, which can limit long-term soil health. Your report will express organic matter as a percentage, and most labs suggest a target of 3% to 5% for optimum vegetable crop production.
Salinity (Electrical Conductivity)
Salinity is measured as electrical conductivity (EC) in millisiemens per centimeter (mS/cm). High salinity is a real concern for coastal growers in the Watsonville area, where repeated fertilizer applications and recycled irrigation water can build up salt over time. When EC climbs above crop tolerance thresholds, germination rates drop and transplants can struggle. Lettuce is moderately sensitive to salt stress, especially at the seedling stage.
Turning Your Report Into a Field Action Plan
Start with pH correction. If your pH is outside the target range, apply lime to raise it or sulfur to lower it before adding any other amendments.
Next, address macronutrient deficiencies. Use the report's recommendations to calculate fertilizer rates by crop type and expected yield, then work with your agronomist to choose the right fertilizer form, whether dry granular, liquid, or a fertigation blend.
For micronutrient issues, targeted foliar or soil applications are often more efficient than broadcast treatments. Retest after one to two growing seasons to track whether corrections are holding.
If EC is elevated, consider a pre-plant leaching irrigation to flush excess salts below the root zone. Pairing your soil report with an irrigation water analysis helps you model how much salt your water source adds each season. Scheduling regular agricultural soil analysis testing is one of the most reliable ways to stay ahead of salinity buildup before it affects crop performance.
Get Accurate Results for Your Watsonville-Area Fields
Knowing what your soil report says is only the first step. Acting on it with reliable, precise data is what protects your crop investment season after season.
Control Laboratory, serving Watsonville, CA, and the surrounding Monterey County growing region, provides the agricultural soil analysis growers depend on for confident field decisions. Whether you grow lettuce in the Salinas Valley or artichokes along the coast, accurate results support smarter fertilizer and amendment choices.
Request a soil analysis or contact the team today to get started. You can also reach the lab directly at (831) 724-5422.
Find us also
on Google Maps.